Table of Contents
Overview and Objective
This project integrates the entire workflow of scraping and analyzing broker transaction data from stock exchanges into a semi-automated end-to-end system. The system automatically scrapes broker transaction data on a daily or weekly basis, stores it in a centralized SQL server, and updates an interactive data analysis dashboard for near real-time visualization.
By combining data collection, storage, and analysis into a single pipeline, the system delivers continuous, up-to-date insights into broker activities and market trends—minimizing manual intervention. The end goal is to enable ongoing data monitoring and provide timely insights to support strategic decision-making for traders, investors, and financial analysts.
Motivation and Inspiration
As financial markets evolve rapidly, relying on outdated or static data limits the ability to act effectively. The motivation behind this project is driven by the need for continuous updates, improved automation, and faster access to reliable insights.
Previously, data collection and analysis were performed separately, requiring significant manual effort and causing delays in insight generation. To overcome these inefficiencies, this project was initiated to build a dynamic and self-updating system that provides real-time visibility into broker behavior.
By automating the full workflow—from data scraping to dashboard updates—the project supports an agile and proactive approach to market analysis, allowing users to stay ahead of trends and make more informed investment decisions.
Project Reference
Workflow
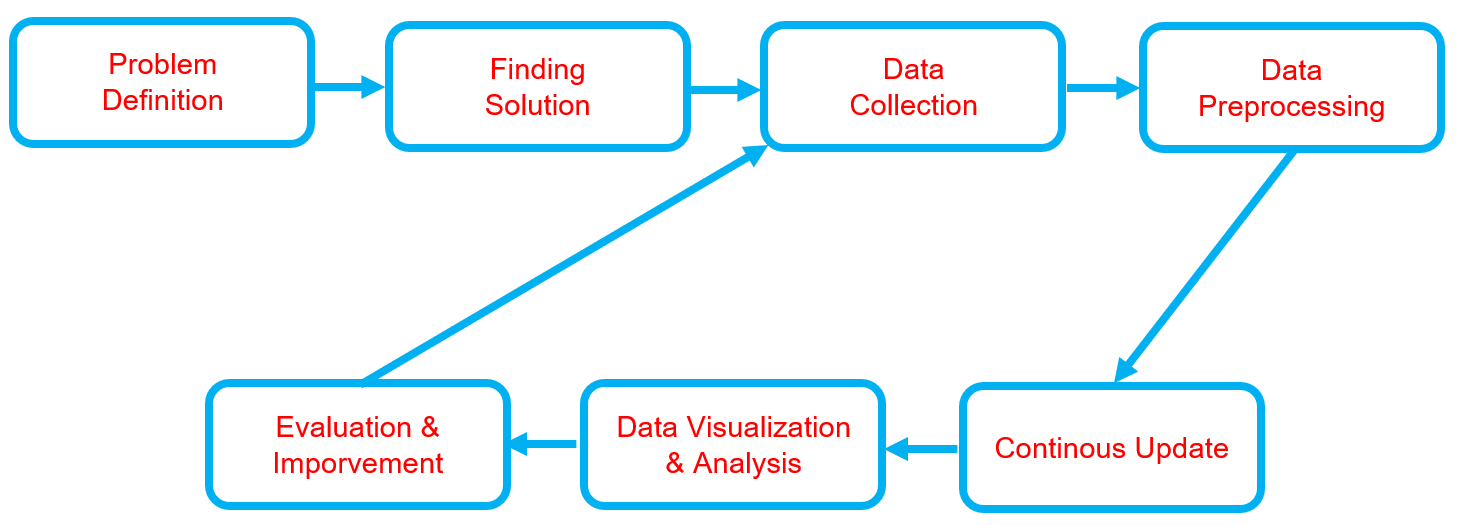
Below is the workflow on how my project works
-
Problem Definition
- Clearly define the problem that needs to be solved.
- Clearly define the problem that needs to be solved.
-
Finding Solution
- List all potential solutions and choose one for implementation.
- Develop a plan outlining the expected outcomes.
-
Data Collection
- Gather and prepare relevant datasets aligned with the problem.
- If batch datasets are unavailable, develop a data collection process such as web scraping.
- Ensure data quality and resolve any data issues.
-
Data Preprocessing
- Handle missing data or outliers.
- Clean and structure the data.
- Perform data transformation.
- Store data appropriately.
- Backup the data.
-
Continuous Update
- Regularly update the dataset or as needed.
- Regularly update the dataset or as needed.
-
Data Visualization & Analysis
- Univariate analysis - (numerical data): Use histograms, box plots, and density plots to understand distributions.
- Univariate analysis - (categorical data): Use bar charts or pie charts to observe category frequencies.
- Bivariate analysis: Analyze relationships between two variables.
- Multivariate analysis: Examine interactions between three or more variables, often visualized with pair plots or heatmaps.
-
Evaluation & Improvement
- Evaluate inputs, processes, outputs, and outcomes.
- Identify challenges.
- Gain insights.
- Implement necessary improvements by addressing challenges, adding new features, or refining results based on evaluation feedback.
- Develop a plan for future enhancements.
Solution and Technology Stack
Used tools:
- Python library :


- Hardware : Laptop Acer Predator Helios 300, Intel-12700H, 48 GB Ram, Gen4 SSD, RTX3070Ti Laptop GPU, 8 GB Vram
Project Details and Results
-
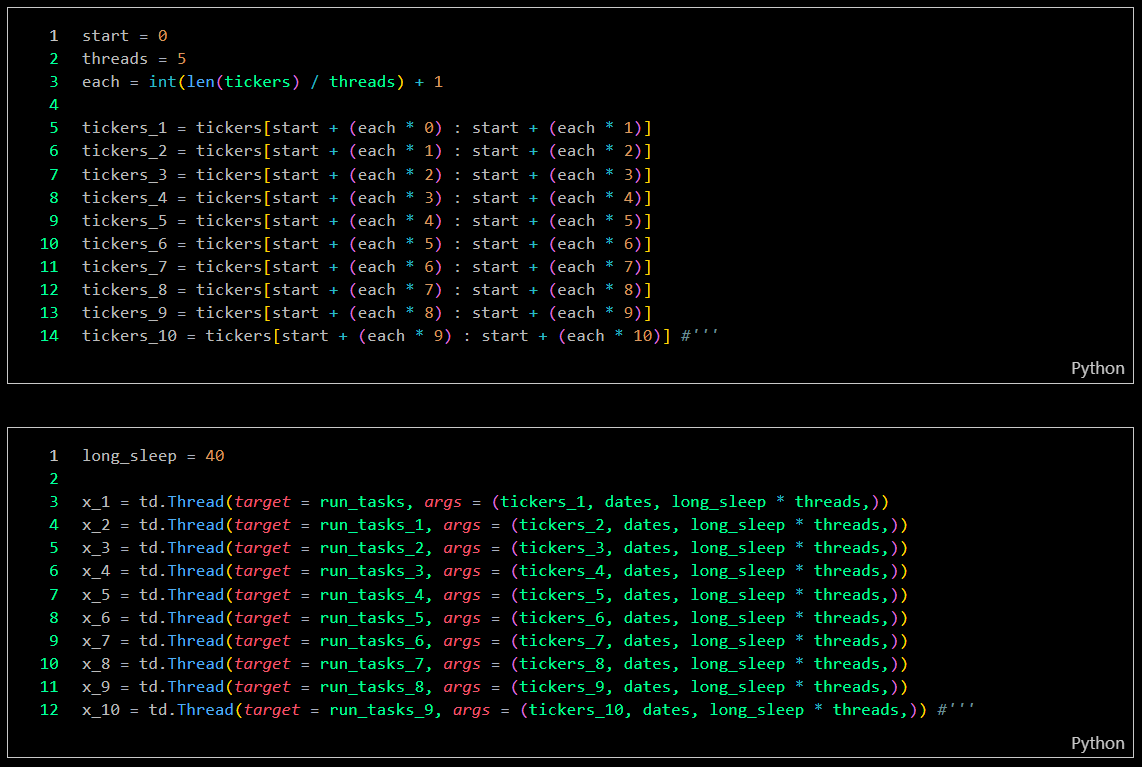
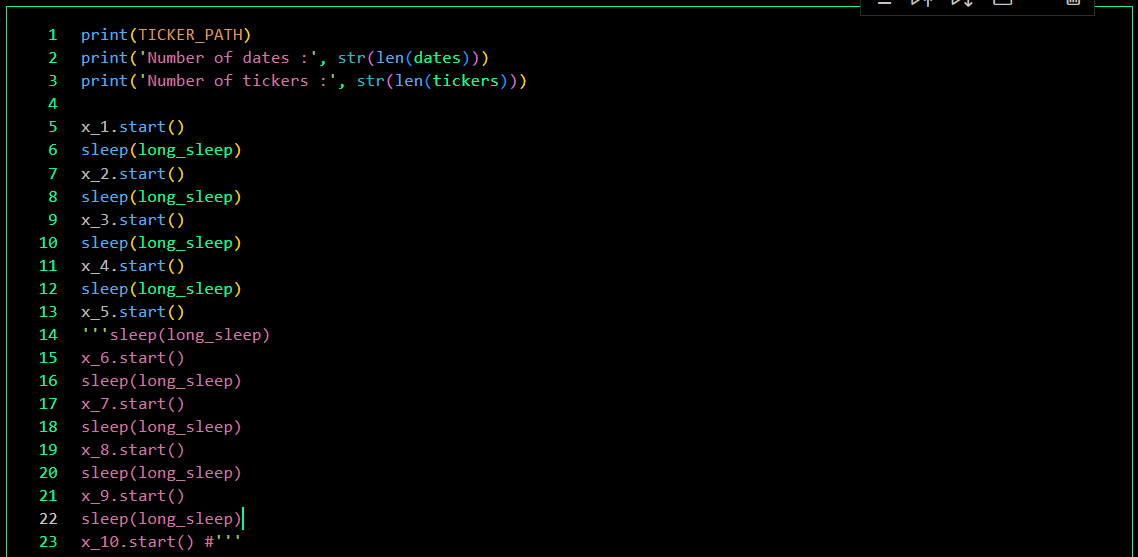
Data Collection
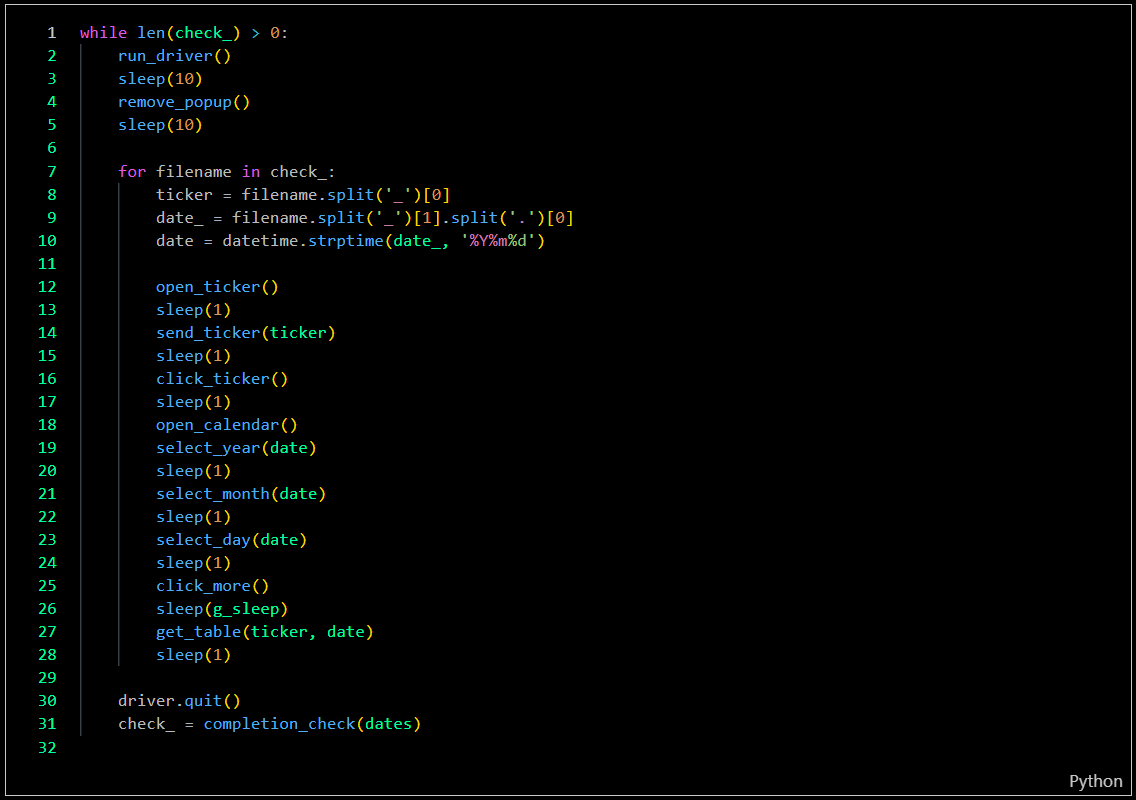
The data collection program, developed with 10 integrated bots, automatically updates ticker data, checks for data completeness, and re-collects incomplete data. The program can be scheduled to run on specific dates, weekly updates, or daily updates. Currently, I am using only 5 bots to reduce the workload on my computer. These bots are capable of collecting data for over 900 companies in just 50 minutes each day.
-
Collection process

-
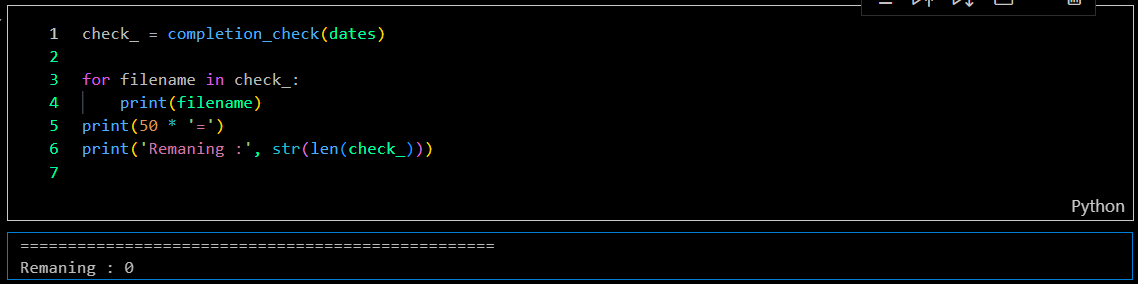
Completion check
-
Recollection process
-
-
Data Process
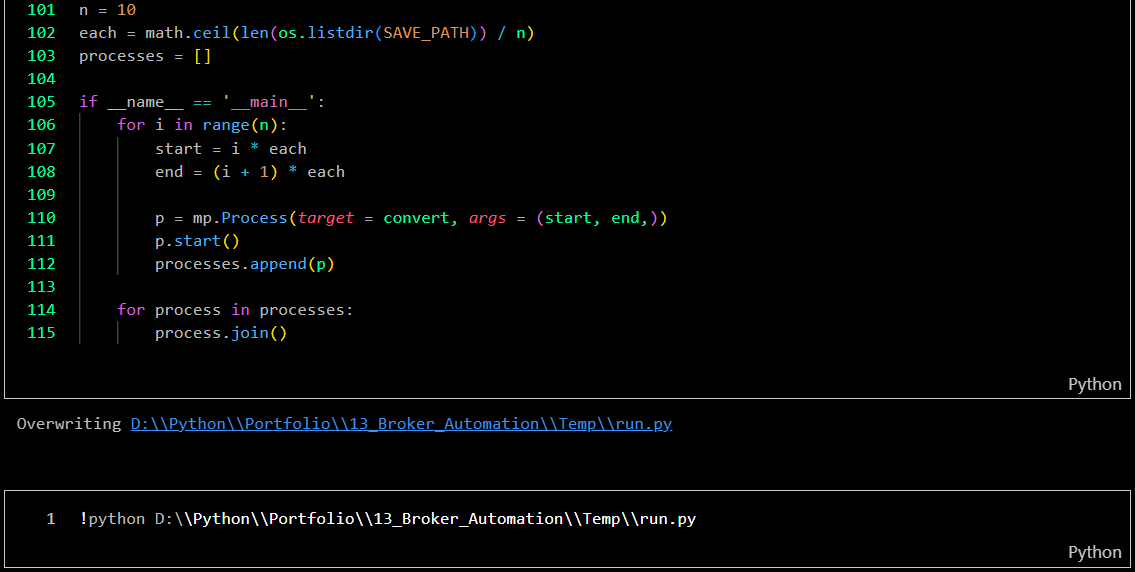
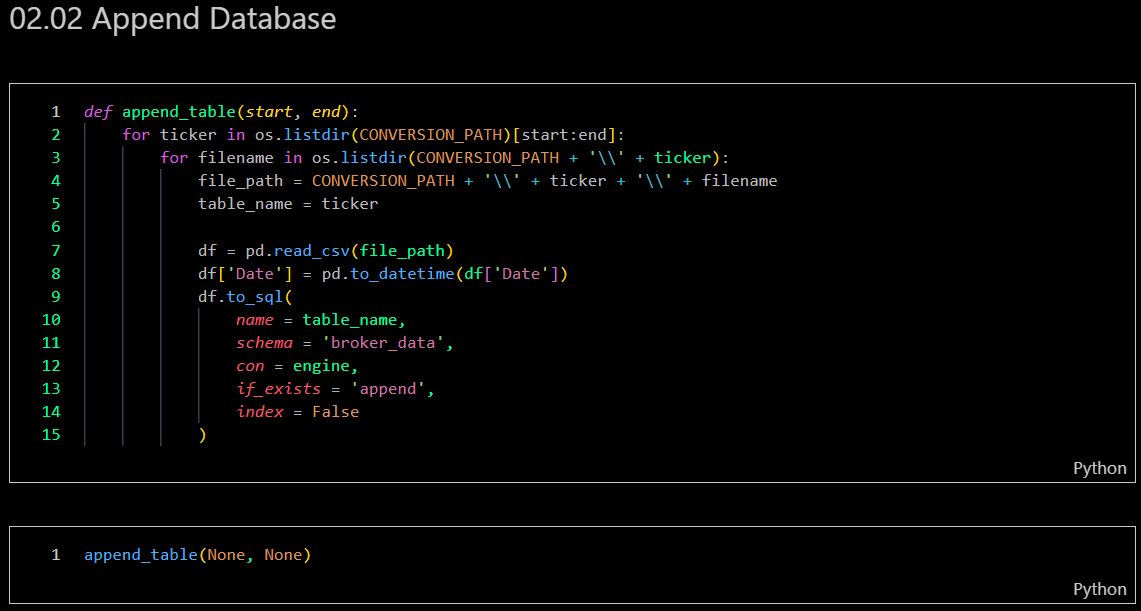
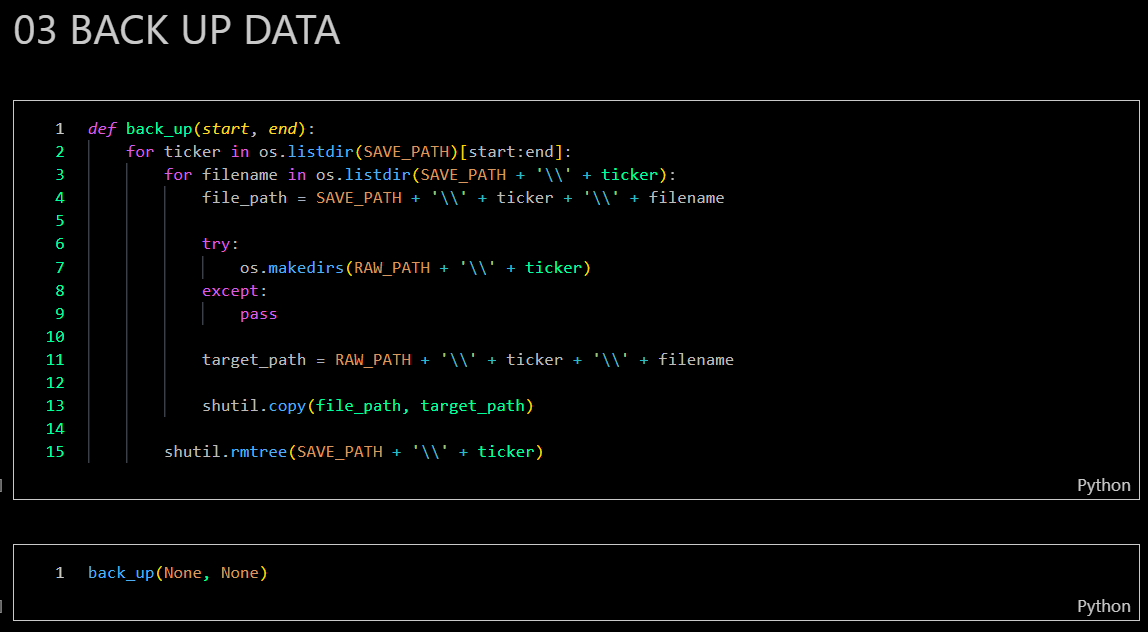
In this step, the program will execute the ETL process (Extract, Transform, Load), including backing up raw data. The process involves extracting information from raw data, transforming it into numerical data, reformatting the data frame, merging all data, then uploading it to my SQL server, and followed by backing up the raw data.
-
Data conversion by leveraging multiprocessing
-
Uploading dataset to SQL server
-
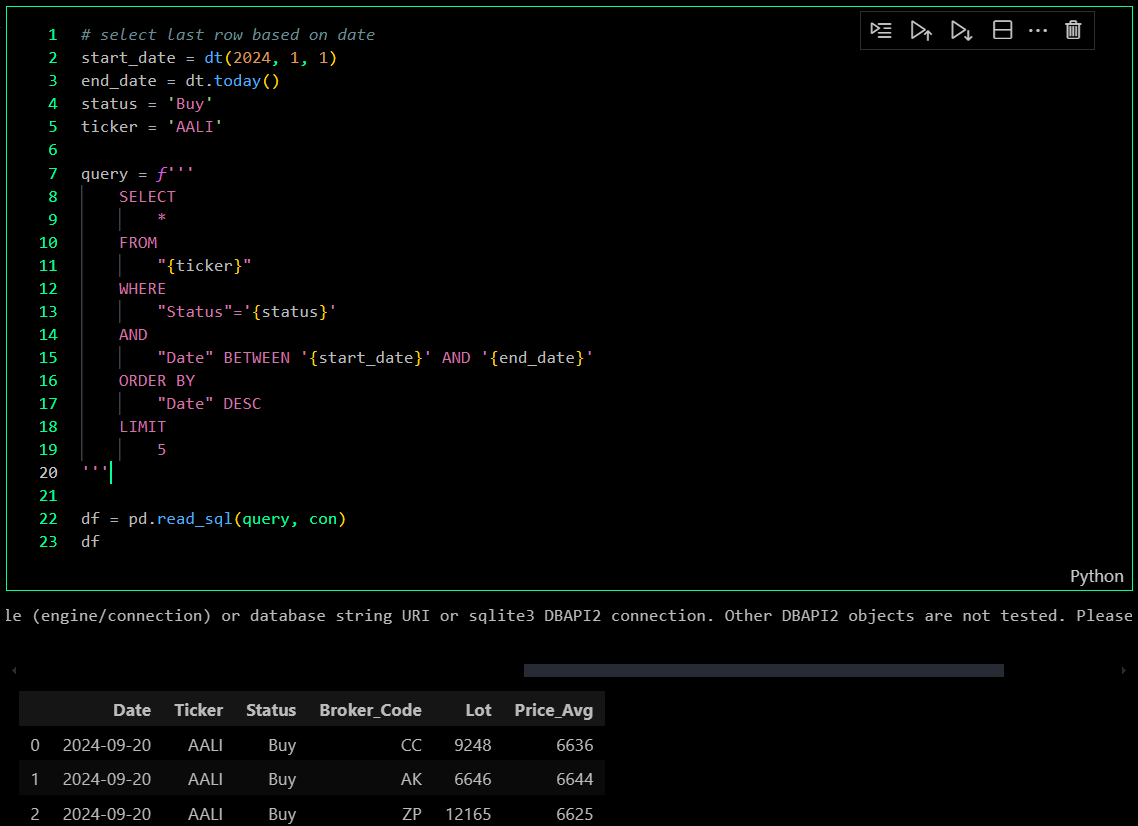
Result & preview
-
Back up dataset as raw files
-
-
Data Visualization
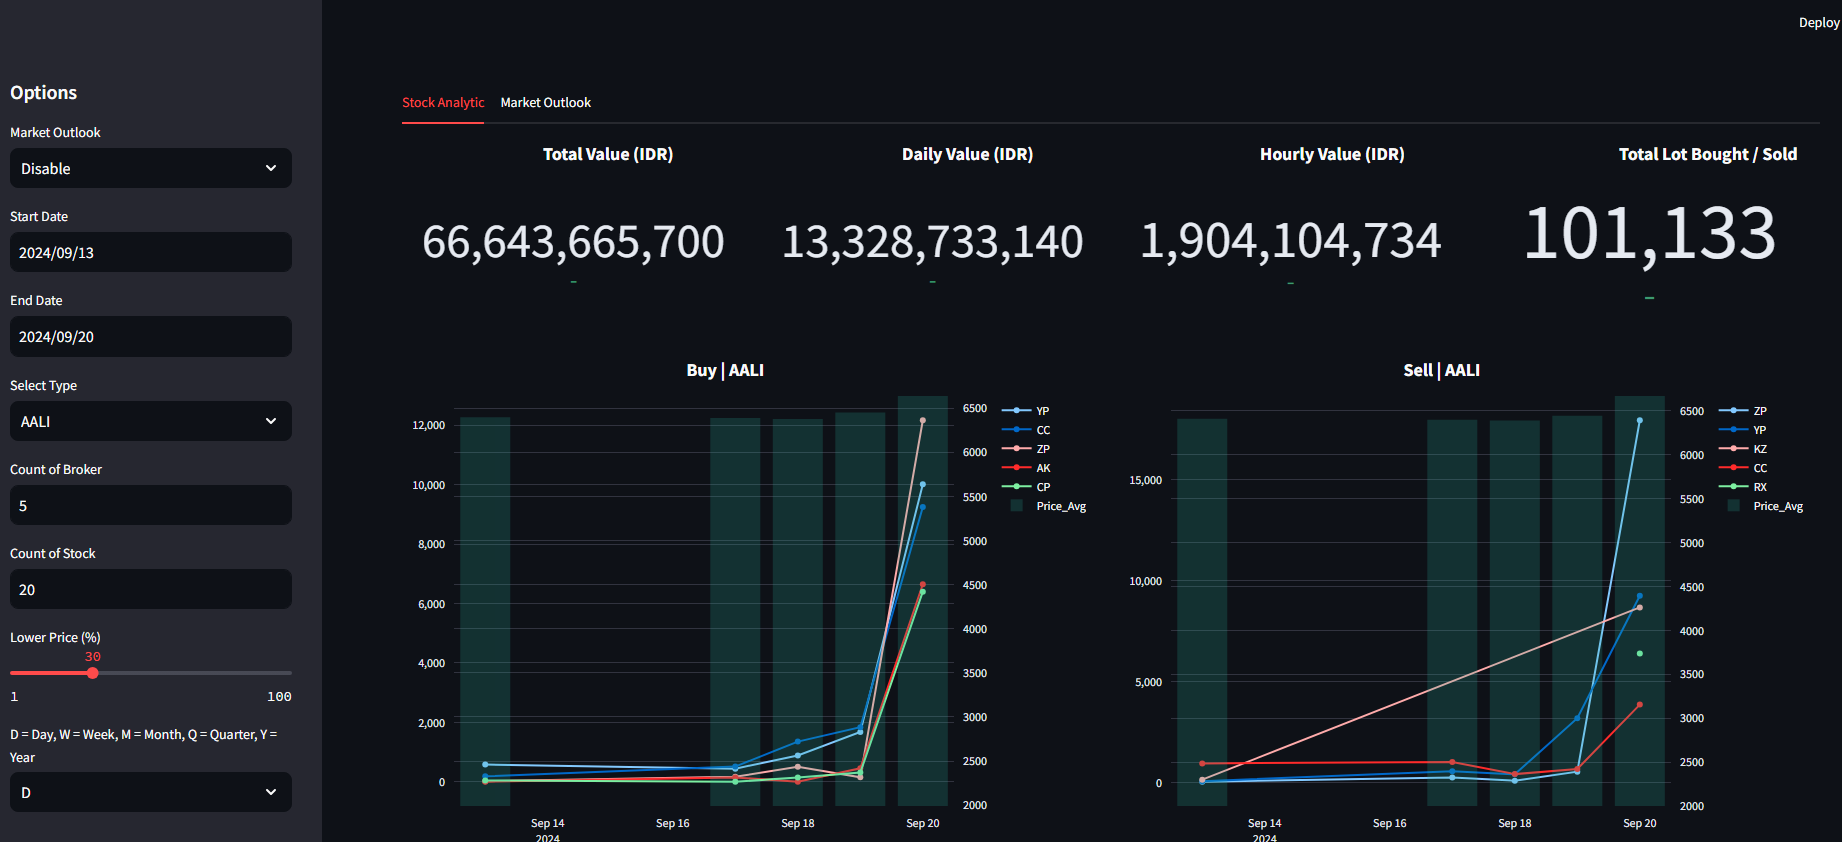
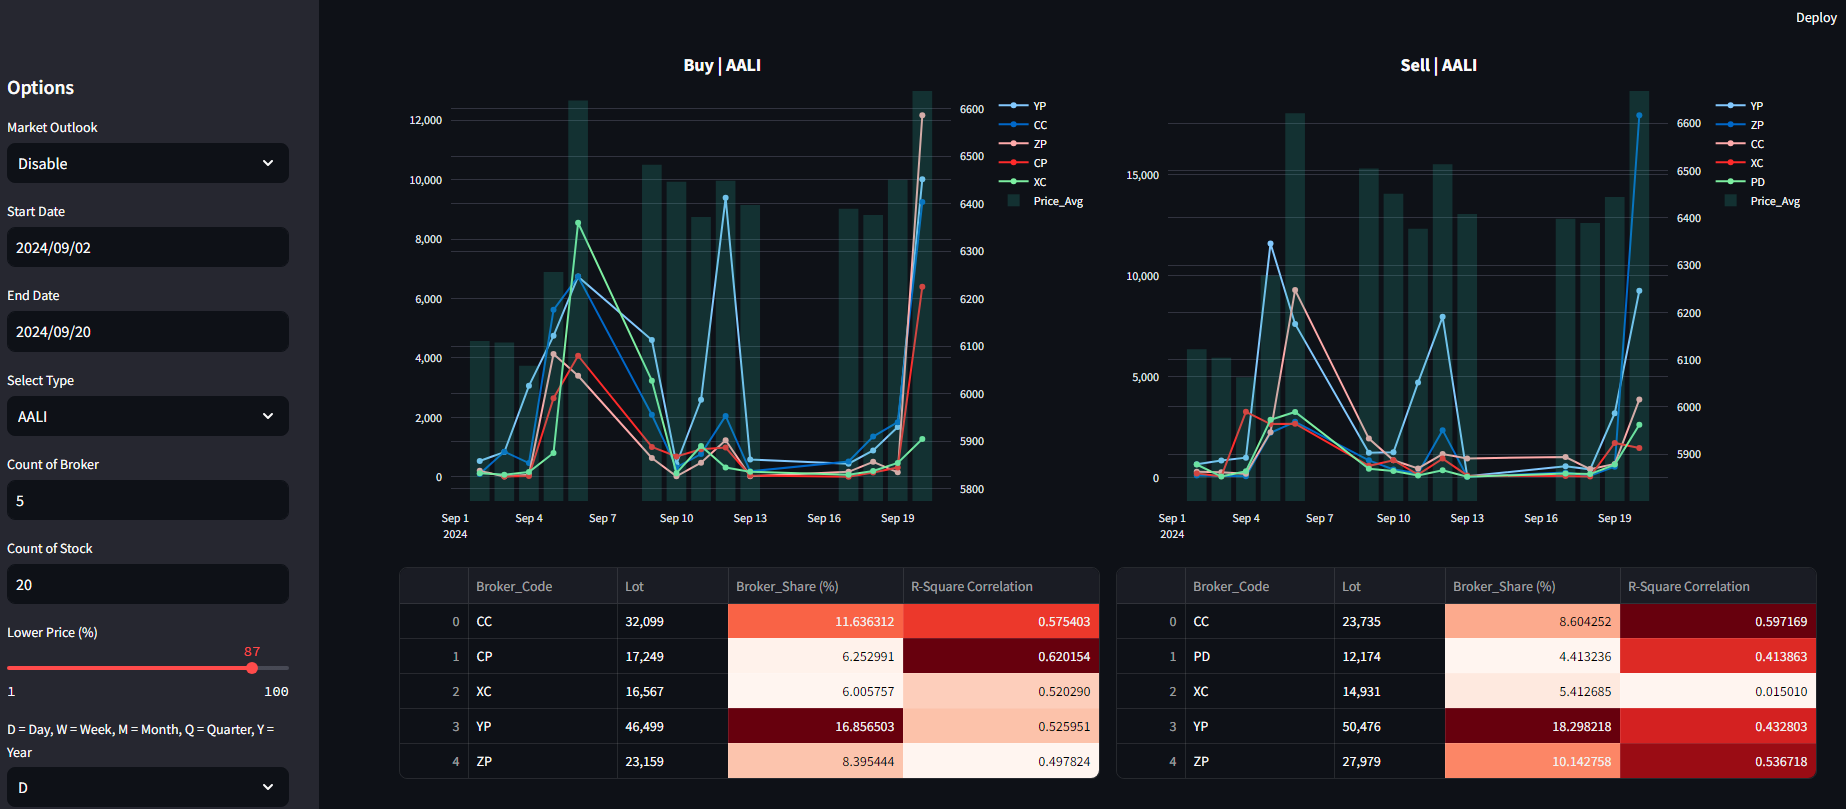
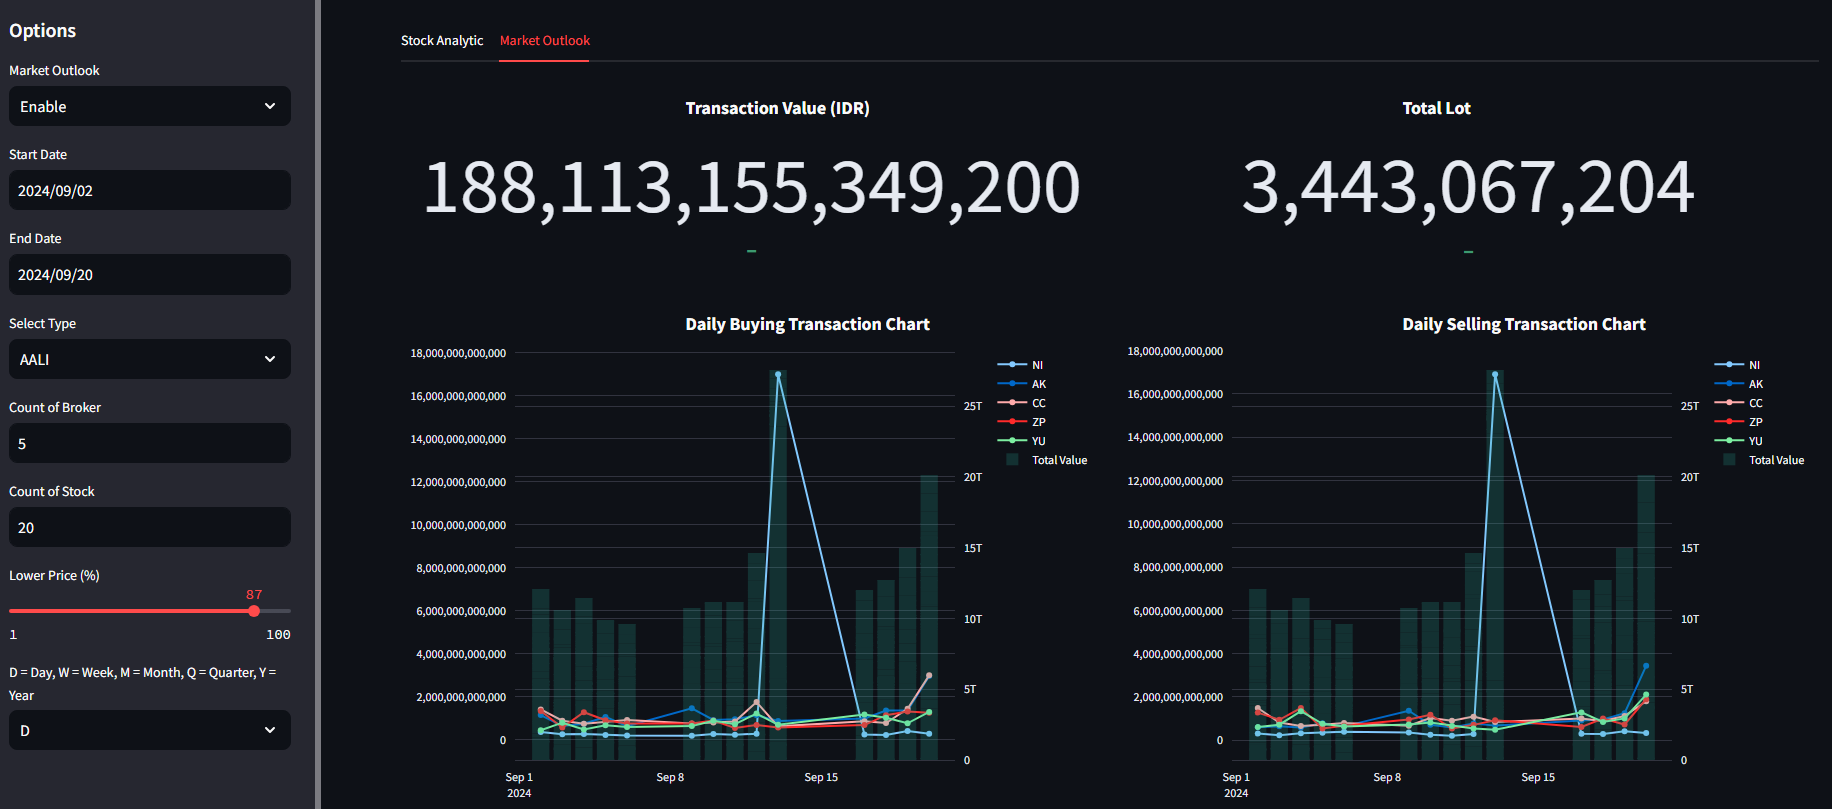
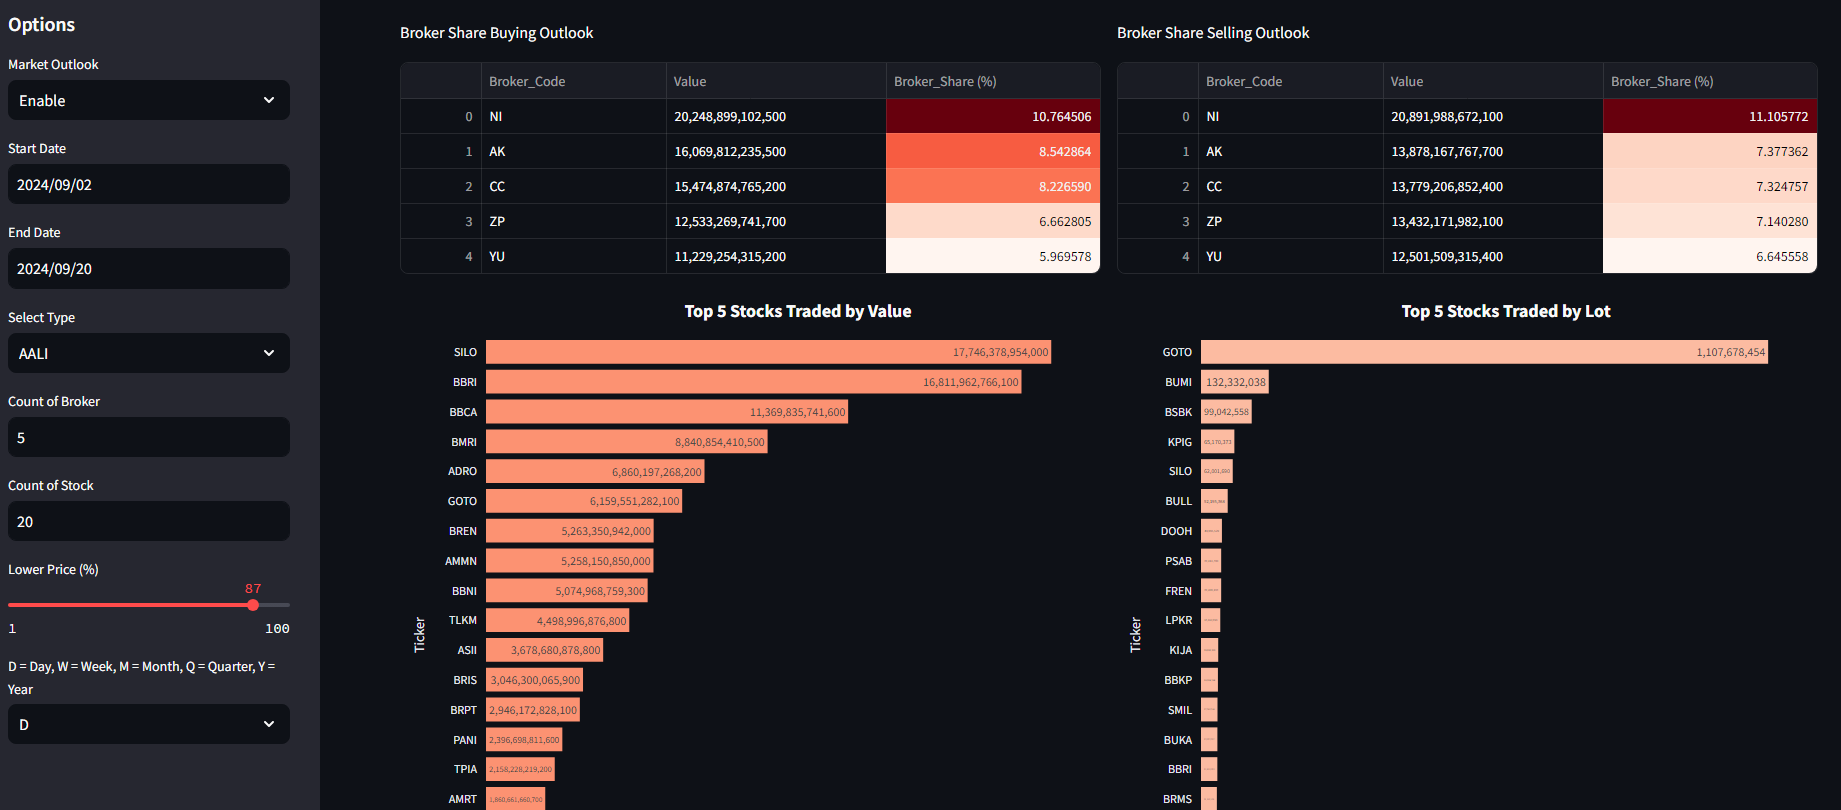
Data visualization is created using Plotly and Streamlit for interactive dashboards, capable of querying datasets from the SQL server, processing calculations based on predefined functions, and then visualizing the data.
Notes:
This project has the potential to be developed into a fully automated system by deploying the program to a hosting server that operates 24/7. However, at the moment, I don't have the necessary equipment to build a server for running the bots and hosting the interactive dashboard as a web application.
Challenges
- Scheduling and Performance: Ensuring that data scraping and processing tasks run efficiently and effectively.
- Scalability Challenges: As data volume and sources grow, the scheduling system must scale accordingly. This can be challenging when faced with limited resources or high-frequency data requirements.
- Concurrency Management: Handling multiple scraping tasks simultaneously while avoiding race conditions and ensuring data integrity during parallel operations.
- Network Latency Handling: Addressing network latency issues that can cause delays in data uploads, impacting the timeliness of data availability for analysis.
- Conflict Resolution: Developing robust mechanisms to resolve conflicts and ensure consistency when various sources provide overlapping or conflicting data updates.
- Data Backup and Recovery: Implementing efficient backup and recovery processes to prevent data loss or corruption during synchronization failures or server downtime.
- Automation Reliability: Ensuring that automated workflows are resilient to website structure changes, errors, or disruptions in scraping and analysis.
- Dynamic Dashboard Updates: Guaranteeing that data analysis dashboards can be dynamically updated with new data without manual refreshes, automatically reflecting the latest insights.
- Data Storage and Query Optimization: Implementing data storage strategies and optimizing queries to ensure dashboards remain responsive, even with frequent updates and large datasets.
- Visualization Scalability: Ensuring that visualizations and analytics scale seamlessly with growing data volumes, preventing performance degradation as datasets expand.
Insights
- Seamless Data Flow: Automating the entire process, from data scraping to visualization, ensures an uninterrupted flow of information, delivering fresh insights as soon as new transactions occur.
- Reduced Manual Intervention: Automating the entire workflow minimizes the need for manual data handling, reduces errors, and frees up resources for more complex analytical tasks.
- Parallel Processing: Multiprocessing enables launching multiple browser instances simultaneously, each performing independent scraping tasks. This parallelism significantly reduces overall execution time, especially when tasks involve large-scale data downloads.
- CPU and Memory Utilization: Running multiple Selenium instances can be resource-intensive. Efficient use of CPU cores and memory is crucial to ensure that the system can handle multiple browser instances without significant performance degradation.
- Limiting Browser Instances: Controlling the number of concurrent browser instances to match available CPU cores prevents overload and ensures optimal performance.
- Browser and WebDriver Compatibility: Ensuring compatibility between the browser version and the corresponding WebDriver is essential. Version mismatches can lead to unexpected failures.
- Headless Mode: Using headless mode (without a GUI) can significantly reduce resource usage. However, some websites behave differently in headless mode, requiring thorough testing.
- End-to-End Integration: Integrating various stages of data processing, from extraction to analysis, ensures that data remains consistent and reliable throughout the workflow.
- Instant Market Response: With real-time data, users can quickly react to sudden market changes, such as significant trades by influential brokers, enhancing their ability to seize opportunities or mitigate risks.
- Scalability: The system is highly scalable, capable of handling growing datasets and integrating additional sources or new data points with minimal adjustments.
- Efficient Data Management: Storing scraped data on an SQL server ensures efficient data retrieval, storage, and query execution, facilitating the analysis of historical trends alongside real-time data.
- Advanced Query Capabilities: Leveraging advanced SQL query techniques enables users to conduct complex analyses, such as identifying correlations between broker behavior and stock performance over time.
Future Plans
- Advanced Monitoring & Alerts: Implementing an alert system that notifies users of significant changes in broker activity or market trends as detected by the automated system.
- Custom Scheduling Options: Offering flexible scheduling options that allow users to adjust scraping intervals based on market conditions or specific needs, such as intraday data collection.
- Cloud Integration: Expanding the system's capabilities to integrate with cloud platforms, ensuring data access and dashboard updates from anywhere, enhancing team collaboration.
- Enhanced Security & Compliance: Strengthening the security of the automated system to protect data scraping processes, SQL servers, and dashboards from unauthorized access or breaches.
- Machine Learning Enhancements: Integrating machine learning models to uncover deeper patterns in broker transactions and automate predictions based on both new and historical data.
- AI-Driven Insights: Developing AI-based analytical tools to automatically identify significant market events, such as sudden changes in trading volumes or price movements influenced by specific brokers.
- Natural Language Processing (NLP): Leveraging NLP techniques to analyze accompanying text data, such as news articles or broker commentary, to assess sentiment and its impact on trading.
Real World Use Cases
- Daily Trading Signal Generation for Retail Investors: With automatic updates of broker activities fed into a live dashboard, retail investors can receive daily or weekly actionable signals, such as detecting sudden entry of institutional brokers or consistent accumulation phases, empowering them to make timely buy/sell decisions without manual data tracking.
- Automated Investment Research for Analysts: Financial analysts working in research firms or fintech startups can rely on the semi-automated pipeline to continuously feed structured broker data into their models, enabling real-time tracking of market sentiment and broker behavior without spending time on repetitive data collection tasks.
- Smart Alerts for Portfolio Monitoring: Portfolio managers and algorithmic traders can use the system to set threshold-based alerts that notify them when specific brokers become active in a stock or sector they follow. This can lead to faster response times and data-driven rebalancing decisions.
- Market Intelligence Reports for Advisory Firms: Investment advisors can leverage the continuously updated insights from the dashboard to prepare weekly or monthly reports for clients, highlighting key broker movements, foreign versus local investor trends, and market anomalies—without needing to manually prepare data.
- Algorithmic Trading Strategy Integration: Quantitative traders can integrate the broker behavior database with their trading algorithms, using broker movement trends as dynamic input features in machine learning models, supporting strategies like momentum tracking or smart money tracing.
- Behavioral Pattern Tracking for Regulatory Oversight: Regulatory institutions or market surveillance teams can use the system to monitor brokers for unusual or suspicious activity patterns in near real-time, making compliance and enforcement efforts more efficient.
- Educational Tools for Financial Literacy Programs: The live dashboard can serve as a real-world teaching interface in investment or finance training programs, allowing students to observe how broker behavior unfolds over time and how it correlates with price action.
- SaaS Product Foundation for Market Analytics: This project can serve as the backend infrastructure for building a Software-as-a-Service (SaaS) product focused on retail traders, offering premium broker insight tools on a subscription basis, and replacing expensive data platforms.
- Event-Based Market Reaction Studies: The continuous data pipeline allows researchers to quickly study how brokers react to corporate actions, earnings releases, or macroeconomic events, by comparing broker behavior before and after events without waiting for manual data compilation.
- Custom Dashboard for Institutional Clients: The system can be extended to build custom dashboards for hedge funds or asset managers, giving them personalized views on selected stocks, broker segments, or regional trading patterns, with automatic updates that reduce research lag.