Table of Contents
Overview and Objective
This project, initiated in 2021, focuses on developing a web scraping system tailored to extract financial report tables in Excel format from stock exchange databases. The system is designed to automate the retrieval of structured financial data, with a particular emphasis on accuracy, scalability, and efficiency.
The primary goal is to create a robust and automated data extraction pipeline that can systematically collect and organize financial reports. This project lays the foundation for building a comprehensive quantitative financial database, enabling deeper data analysis and supporting future financial research.
Motivation and Inspiration
My interest in financial markets and data analysis sparked the motivation for this project. The stock exchange environment, known for its transparency and rich documentation, offers an ideal entry point for collecting financial data.
While mainstream media and platforms offer summarized financial insights, access to detailed historical datasets often comes at a high subscription cost—something that can be a barrier for independent researchers and learners. To overcome this limitation, I developed a custom bot to collect financial report tables directly from public sources.
Manual data retrieval from stock exchange websites is often tedious and time-consuming. This project aims to automate that process, making financial data collection faster, more reliable, and easily repeatable. By doing so, it supports efficient financial research, boosts data accessibility, and helps foster informed investment and analytical decisions without relying on expensive tools or services.
Workflow
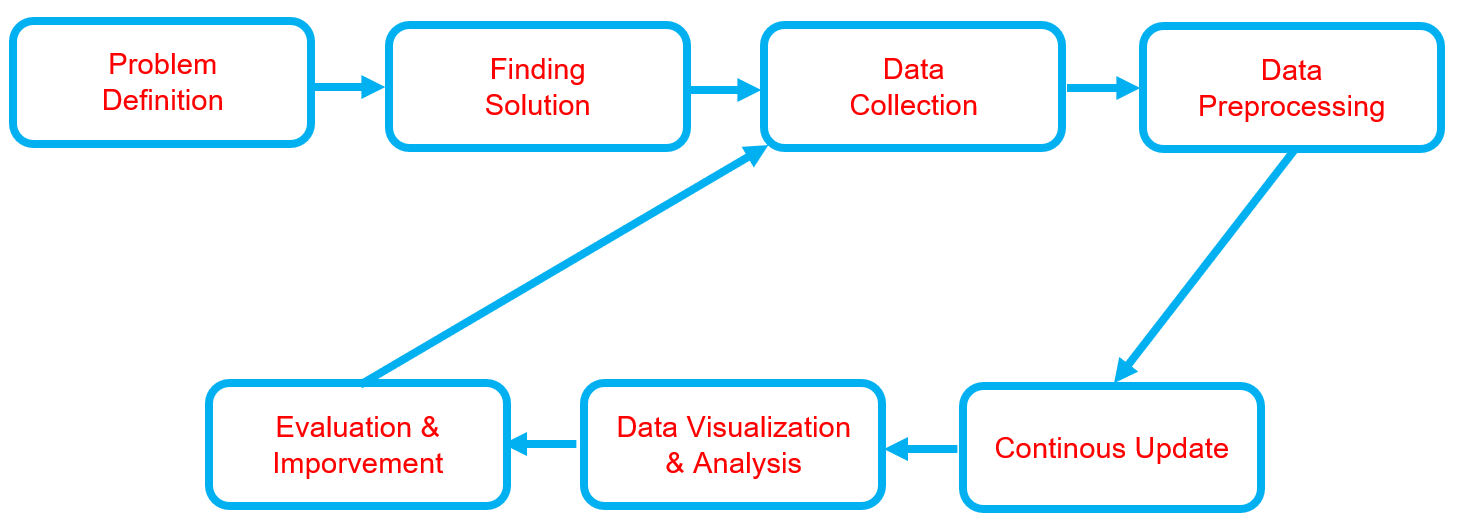
Below is the workflow on how my project works
-
Problem Definition
- Clearly define the problem that needs to be solved.
- Clearly define the problem that needs to be solved.
-
Finding Solution
- List all potential solutions and choose one for implementation.
- Develop a plan outlining the expected outcomes.
-
Data Collection
- Gather and prepare relevant datasets aligned with the problem.
- If batch datasets are unavailable, develop a data collection process such as web scraping.
- Ensure data quality and resolve any data issues.
-
Data Preprocessing
- Handle missing data or outliers.
- Clean and structure the data.
- Perform data transformation.
- Store data appropriately.
- Backup the data.
-
Continuous Update
- Regularly update the dataset or as needed.
- Regularly update the dataset or as needed.
-
Data Visualization & Analysis
- Univariate analysis - (numerical data): Use histograms, box plots, and density plots to understand distributions.
- Univariate analysis - (categorical data): Use bar charts or pie charts to observe category frequencies.
- Bivariate analysis: Analyze relationships between two variables.
- Multivariate analysis: Examine interactions between three or more variables, often visualized with pair plots or heatmaps.
-
Evaluation & Improvement
- Evaluate inputs, processes, outputs, and outcomes.
- Identify challenges.
- Gain insights.
- Implement necessary improvements by addressing challenges, adding new features, or refining results based on evaluation feedback.
- Develop a plan for future enhancements.
Solution and Technology Stack
Used tools:
- Python library :

- Hardware : Laptop Acer Predator Helios 300, Intel-12700H, 48 GB Ram, Gen4 SSD, RTX3070Ti Laptop GPU, 8 GB Vram
Project Details and Results
-
Data Collection Automation
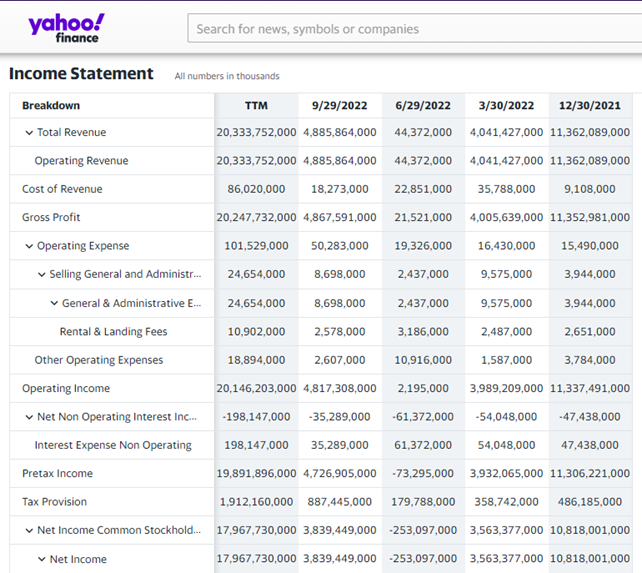
This project is a simplification of a previous one, where I only download Excel files from websites. The reason I focus on collecting Excel files is that I need raw data for conducting data analysis. While several websites like Yahoo Finance, Investing.com, and others already provide financial data for companies, their offerings are limited and the data is pre-cleaned.
At this stage, I am utilizing a multi-threaded bot directly, with tasks differing from the previous bot, which involves a more complex download script. This approach allows me to save time while collecting over 2,500 Excel reports from all publicly listed companies in Indonesia.
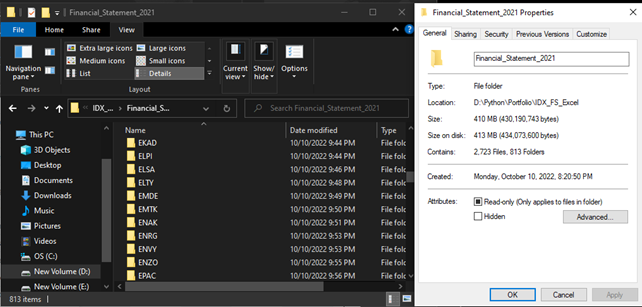
The bot performs the following tasks: it opens Chromedriver, navigates to the website (https://www.idx.co.id/id/perusahaan-tercatat/laporan-keuangan-dan-tahunan), enters keywords into the search tab, selects the year and quarter, clicks “search”/“apply,” downloads the Excel files, and saves them in a temporary directory. The final step involves renaming the files from the temporary path and moving them to a new location with an organized folder structure.
-
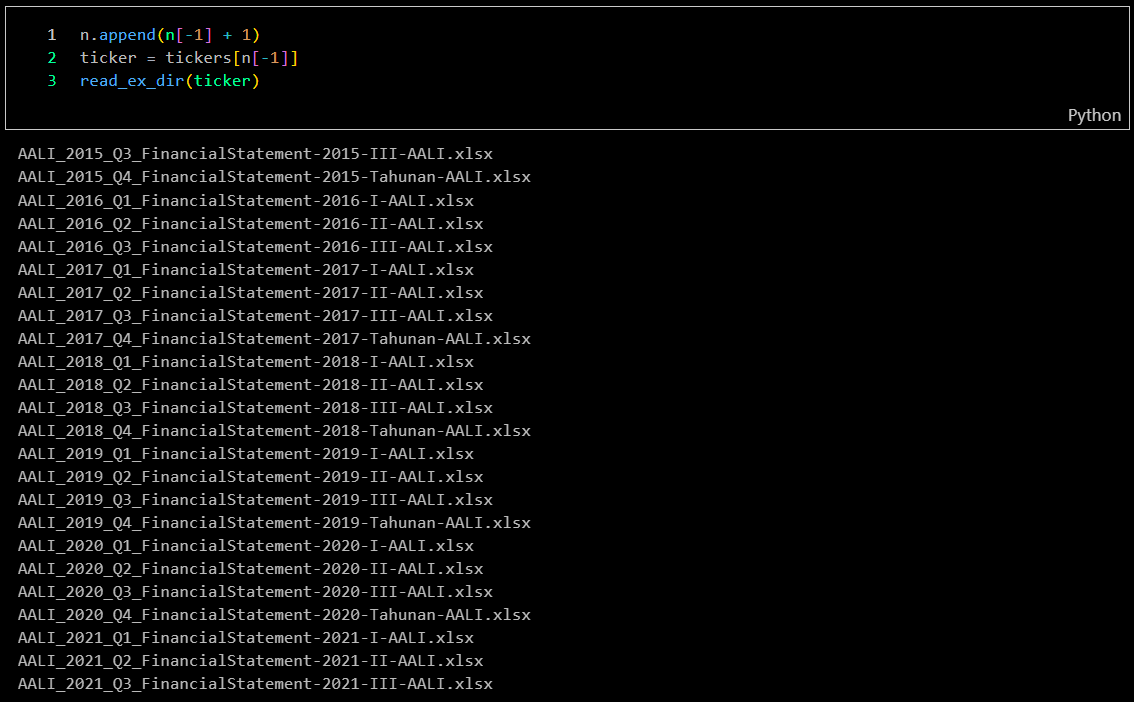
Files Check
After downloading all the Excel financial reports, I need to verify the completeness of the bot's work. Fortunately, I was able to collect financial reports dating back to 2015 using an HTML injection script. However, this method is no longer applicable at this time.
-
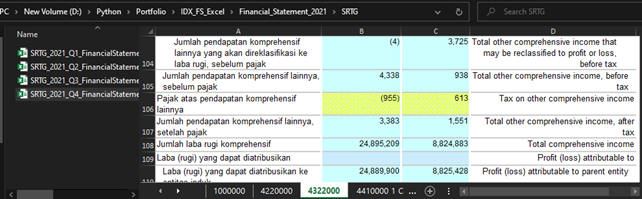
Data Transformation
-
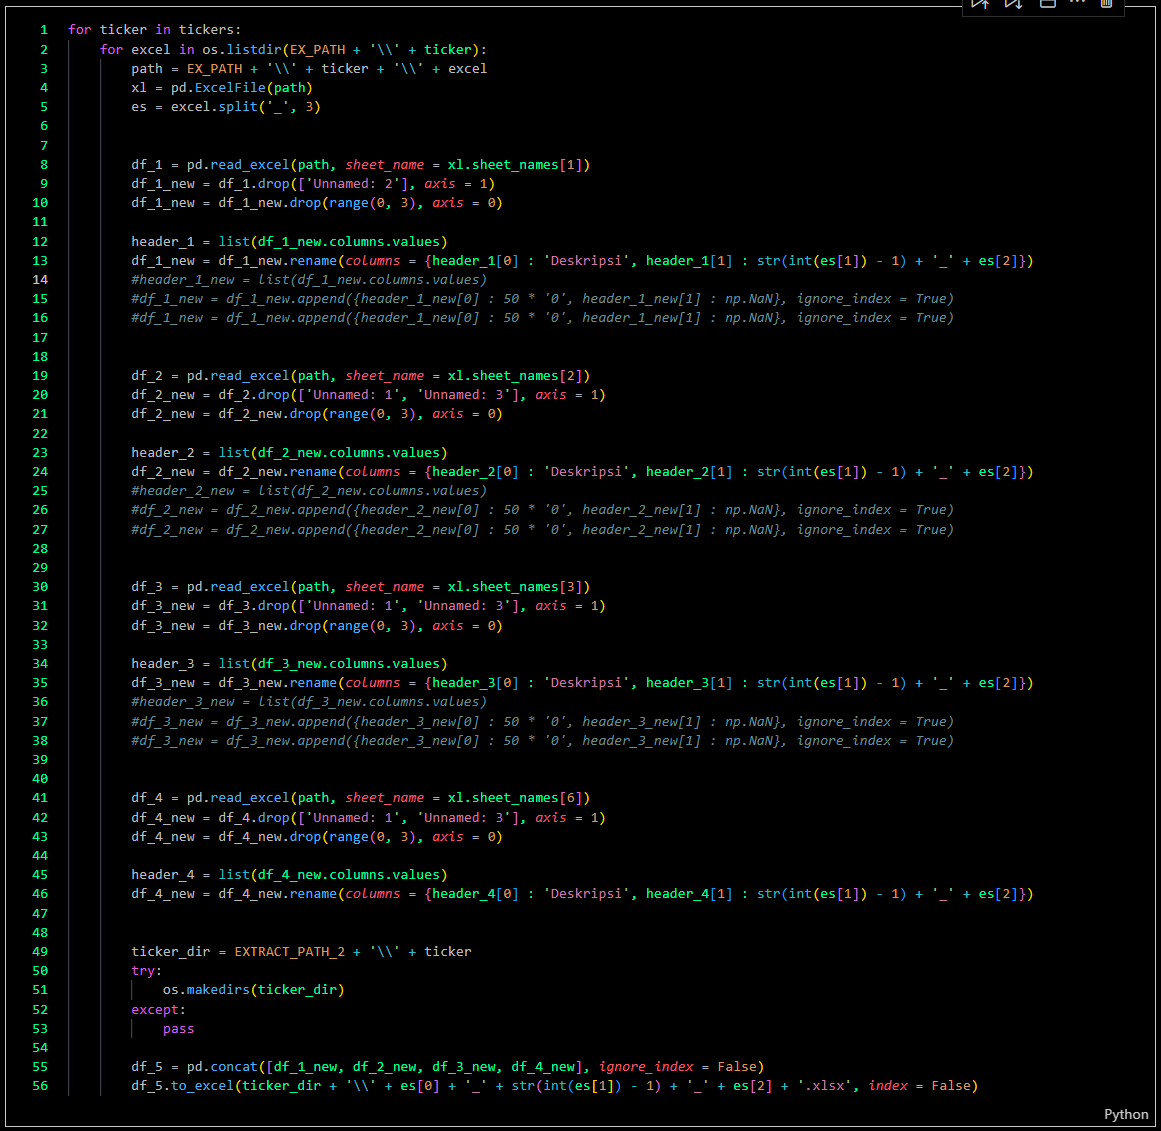
The first data transformation involves extracting tabular data into multiple files.
-
Process
-
Results
-
-
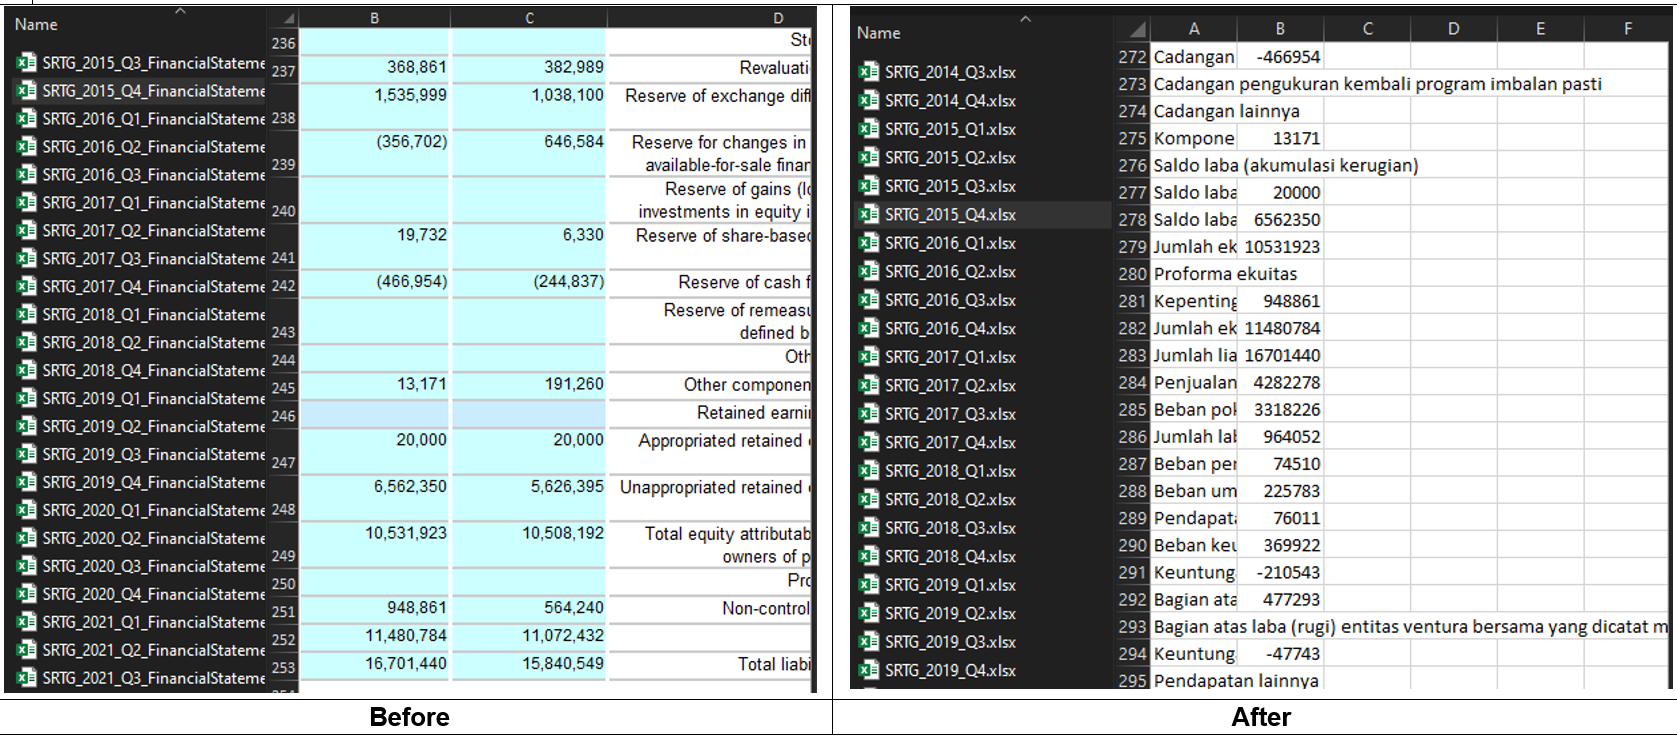
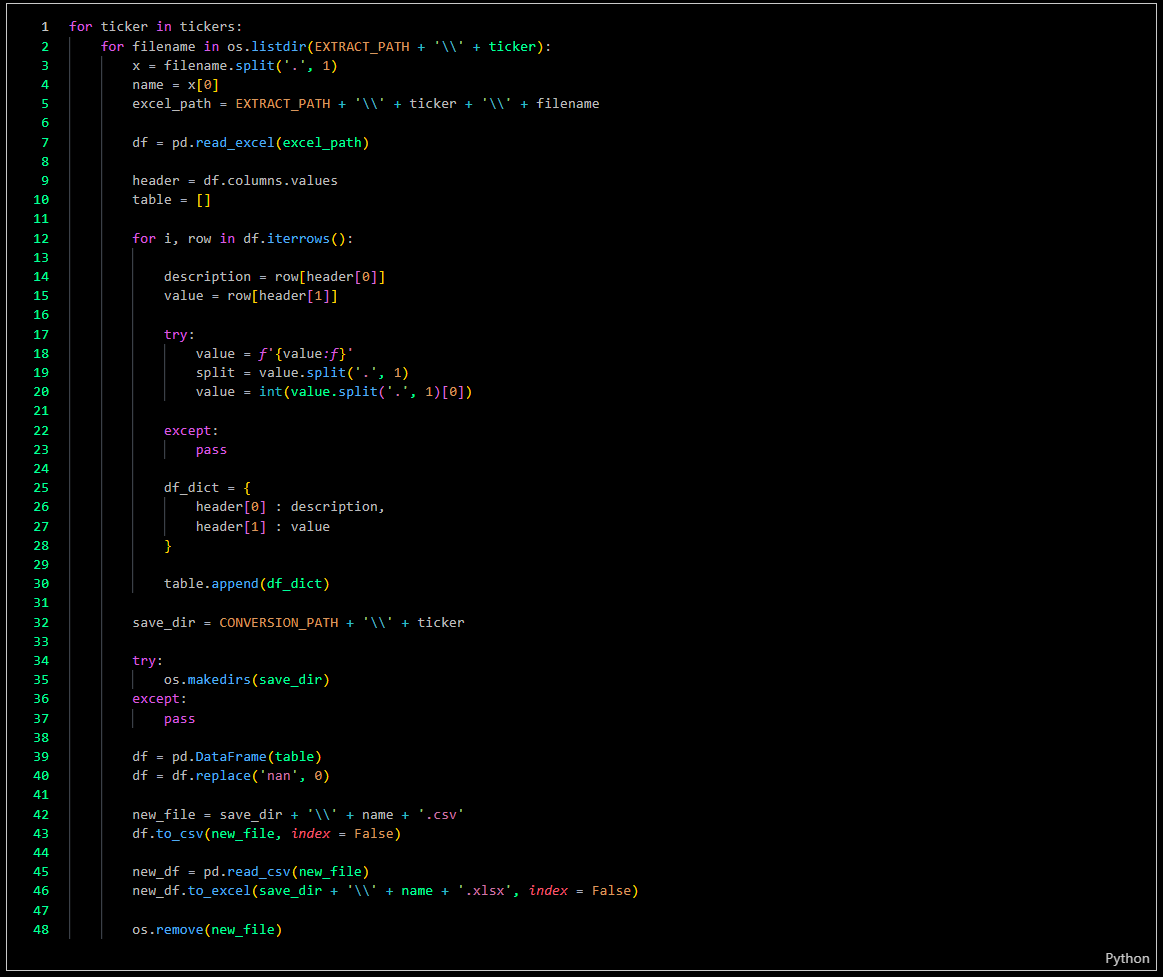
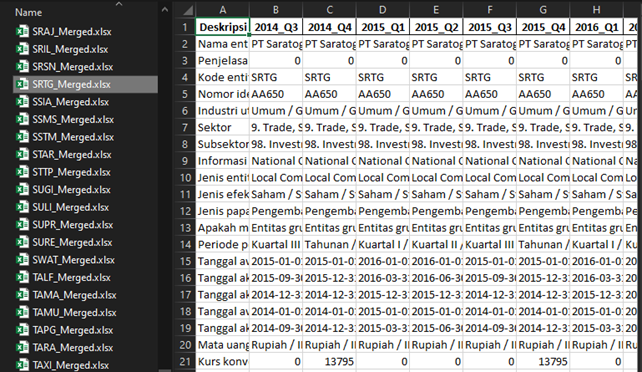
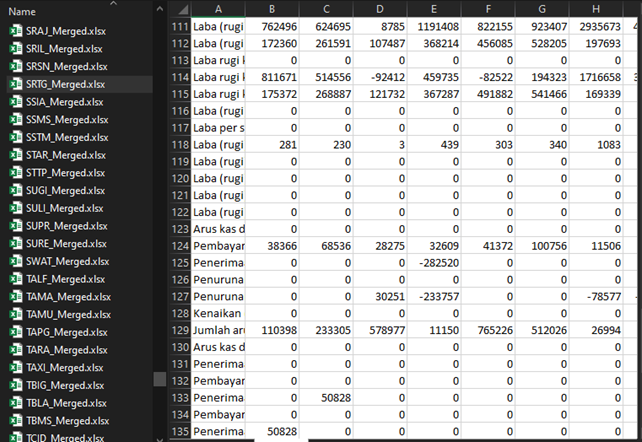
The second step is to convert these files into numerical data, enabling analysis when the files are merged.
-
The final step is to combine the data, and here is an example of the results.
-
-
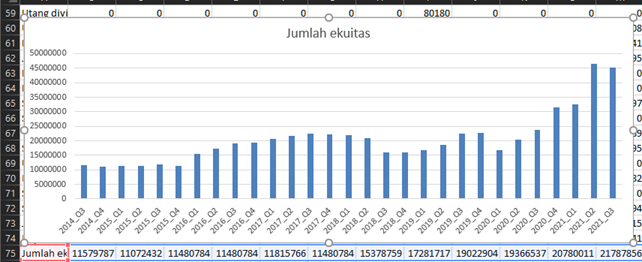
Analytic & Visualization
Currently, data analysis requires accounting methodologies, which will be available once I complete my studies in accounting. As for data visualization, it is still in development; for now, we can use Microsoft Excel to create charts and other visual representations.
Challenges
- Data Collection Speed: Data collection was initially slow due to using only a single bot. Therefore, I developed a multi-threading bot capable of running simultaneously to increase efficiency.
- Network Constraints: Network limitations can affect data quality and potentially cause system crashes. To mitigate this, I need to limit the number of bots running concurrently.
- Handling Pop-Up Messages: Occasionally, pop-ups appear during the process, which needs to be managed effectively.
- Data Quality: Ensuring the accuracy and completeness of the scraped data, and addressing inconsistencies or errors in source documents.
- Website Changes: Adapting to changes in website structure and data formats, which can impact the scraping process and require continuous maintenance.
Insights
- Parallel Browsing: Multiprocessing allows you to launch multiple browser instances simultaneously, each performing independent scraping tasks. This parallelism can significantly reduce overall execution time, especially when tasks involve loading multiple web pages or downloading large amounts of data.
- Limiting Browser Instances: Controlling the number of concurrent browser instances to match the available CPU cores prevents overloading and ensures optimal performance.
- Driver Configuration: Carefully configure each WebDriver instance, including options such as headless mode, to reduce visual overhead and conserve resources.
- Task Assignment: Distribute data or tasks evenly among processes. For example, each process can handle a portion of URLs or a range of search keywords. Proper workload balancing prevents some processes from finishing too quickly while others lag behind.
- Handling Shared Data: If data needs to be shared among processes, use multiprocessing queues or shared memory constructs. Avoid using global variables, as they are not shared across processes.
- Managing Failures: Websites may block or limit requests if they detect bot-like behavior. Implementing try-except blocks and setting up automatic retries for failed requests can help ensure resilience.
- WebDriver Timeout: Set appropriate timeouts for WebDriver operations to prevent processes from hanging indefinitely due to slow-loading pages or network issues.
- Browser and WebDriver Compatibility: Ensure compatibility between the browser and the corresponding WebDriver versions. Version mismatches can lead to unexpected failures.
- Scalability: Designing the system to handle large volumes of data and support scalability will ensure its effectiveness as data needs grow.
Future Plans
- Expanding Data Sources: Enhance the system to capture financial data from additional exchanges and financial databases, thereby broadening the scope and depth of available information.
- Improving Data Processing: Develop tools to process and clean the collected data, ensuring it is ready for analysis and integration into financial models or reports.
- Implementing User Interfaces: Create an intuitive interface for managing and visualizing the collected data, enabling users to easily access and interact with the information.
- Automating Updates: Establish an automated schedule for routine data retrieval and updates, ensuring that financial information remains current and relevant.
- Developing a Database Storage System: Create a database storage system that maintains all collected datasets, making them easily analyzable.
- Building a Comprehensive Analytical Workflow: Design a complete analytical workflow to assess company performance by evaluating both quantitative and qualitative data.
Real World Use Cases
- Foundation for Building a Financial Time-Series Database: The extracted Excel-based financial tables provide clean, structured data ideal for constructing a time-series database. This database can then support long-term trend analysis, performance comparison across companies, and industry benchmarking.
- Fuel for Quantitative and Fundamental Analysis: Individual investors, portfolio managers, and financial analysts can use the scraped Excel data to run ratio analyses, earnings comparisons, and valuation modeling—empowering data-driven investment decisions without relying on costly platforms.
- Educational Tool for Financial Modeling Practice: Students, educators, and self-learners in finance or economics can use the dataset to practice real-world financial modeling, forecast building, and company analysis using spreadsheet software, just as professionals do.
- Input Source for Machine Learning Models in Fintech Projects: The consistently structured Excel tables provide a practical dataset to feed into machine learning pipelines for projects like financial health prediction, fraud detection, or bankruptcy forecasting.
- Supporting Small Investment Advisory Firms or Local Financial Planners: Smaller firms often lack access to enterprise financial databases. This tool allows them to stay informed with up-to-date financial disclosures in an organized Excel format, enabling better client servicing and faster reporting.
- Preprocessing Layer for NLP and Document Parsing Projects: Since Excel files are inherently tabular and machine-readable, they serve as a clean data source for natural language processing (NLP) tasks, such as extracting entity-level financial metrics or building keyword-based classifiers.
- Historical Record Keeping for Longitudinal Studies: Researchers conducting historical studies on company performance, sectoral growth, or economic resilience can use the scraped Excel datasets to create archives that support empirical economic research.
`